See the API Behind Every Page, and Every Request Your Integrations Make
Most Broadcast installs have something else talking to them. A Zapier zap adds subscribers, a checkout app sends receipts through the transactional API, and more and more often an AI agent works through the MCP server. When one of them stops working, the questions are always the same. What did it send? What did Broadcast answer? Did the webhook go out?
Until now, the answers were in the server log, if you had access to the server and knew what to look for. Broadcast 3.4 puts them in the dashboard, in a bar I call the Developers workbench.
The API behind the page
The bar sits at the bottom of each dashboard page. It says how many API operations do the work of the page you look at, how many API errors the channel had in the last 24 hours, and whether a webhook endpoint is delayed. Click it, and the tab This page lists those operations: the method and path, the token permission each one needs, the MCP tool that runs it, and a curl command you can copy.
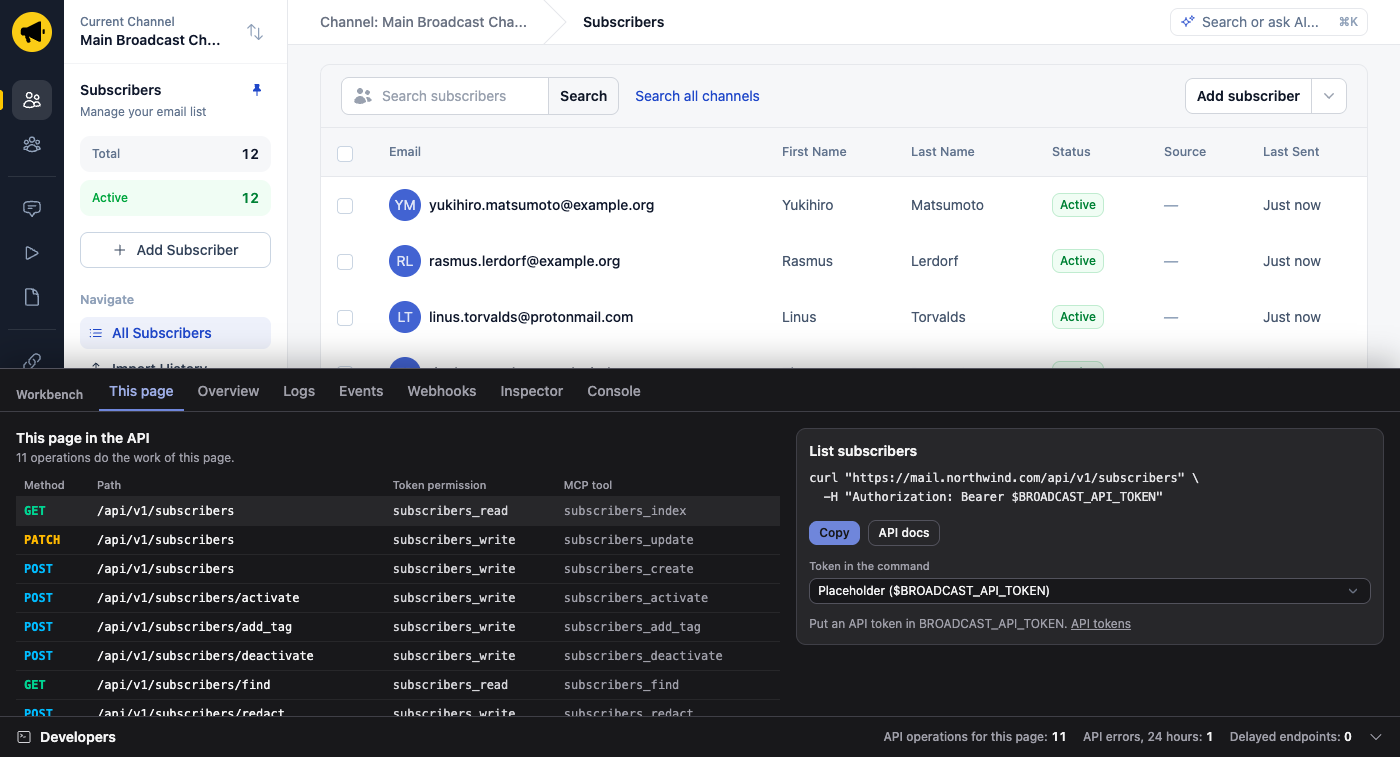
The command uses a placeholder for the token. If you may see the API tokens of the channel, you can select one, and the command then works as it is. The tab also names the things that the page can do and the API cannot, so you know where the API ends before you build on it.
Every request, with what was sent and what came back
The tab Logs lists each request that an API token made to the channel: the time, the method, the path, the status, the duration, the token and the source (the API, the MCP server or a plugin). Click a request to see its request body, its response body and a curl command that sends it again.
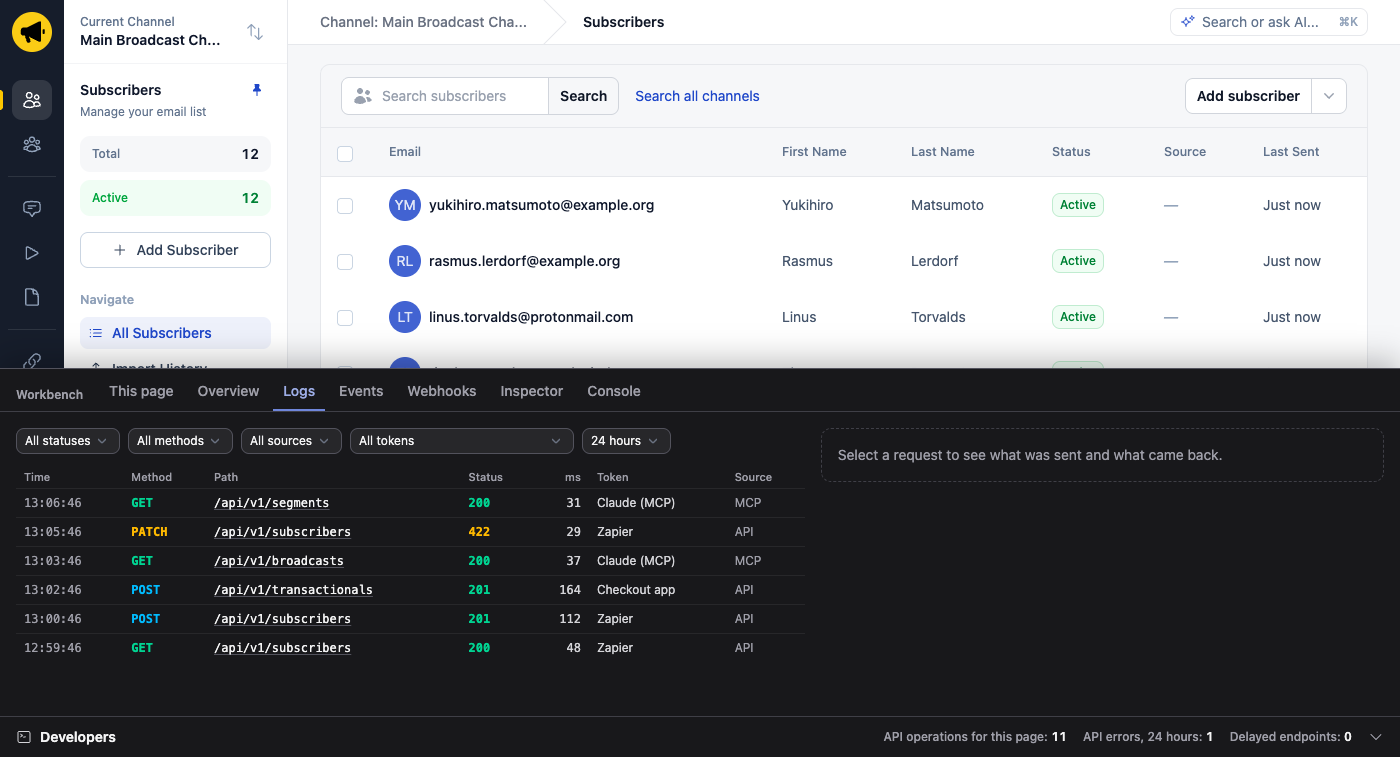
The log holds subscriber data, so I drew some lines. Passwords, secrets, tokens and API keys in a body are replaced with [FILTERED], and the Authorization header is never stored. The bodies are encrypted in the database, and a request stays 7 days. A request that the rate limit refused is not stored, so a client stuck in a retry loop does not fill your database. If you do not want the log at all, set API_REQUEST_LOG=off.
Next to Logs are four more tabs. Events lists what happened in the channel, such as subscriber.created or broadcast.sent, with or without a webhook endpoint, and the deliveries of each event. Webhooks shows the state of each endpoint and the deliveries that did not arrive. Inspector shows the record of the page as the API returns it. Console runs an API operation with a token of the channel, and asks you to confirm before anything that changes data.
Who sees the workbench is a new channel permission, Use the Developers workbench. The Manager role has it after the upgrade. Each user can hide the bar in their profile.
Three afternoons it saves
A Zapier zap that adds subscribers starts to fail on Tuesday. Open Logs, select Errors, and the 422 is there with its body: the zap sends the name field where the email address should be, and Broadcast answers that the email is invalid. You fix the zap without opening the server.
A developer builds a checkout integration and wants the exact call for a transactional email. They open the Transactionals page, copy the curl command from This page, select their test token, and have a working request in a minute. When they are done, the request is in Logs with what Broadcast answered.
An agent that works through the MCP server did something you did not expect. Filter Logs to the source MCP, and each tool call is a row, with the body it sent. Events shows what the calls changed.
Ask AI from quick jump
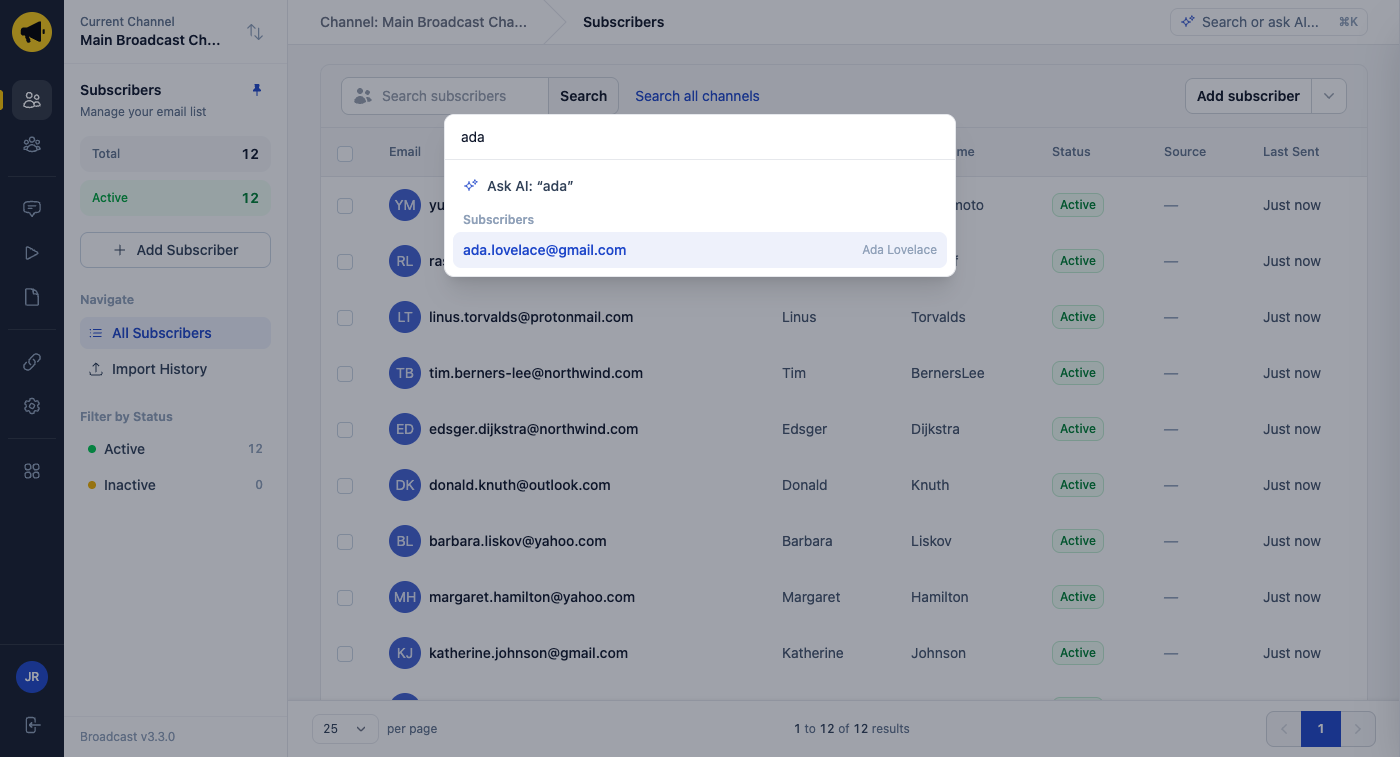
One smaller change. The Ask AI tab used to sit on the right edge of every page. It is gone. The search at the top now reads Search or ask AI: press Cmd+K, type a question, and the first row asks the assistant. When a page or a record matches, it still keeps the highlight, so Enter still opens it.
All of this shipped in Broadcast 3.4.
See the Developers workbench documentation, or read how the MCP server and the users API work.