Knowing When Your Own Server Goes Down
The honest weakness of self-hosting is not setup. Setup is a Sunday afternoon. The weakness is the Tuesday six months later when the box runs out of disk at 3am and nobody is watching it.
With hosted software somebody is paid to notice. When you run it yourself, the noticing is your job too, and the usual way you find out is that a campaign did not go out and someone asks you why. That is a bad way to learn.
Broadcast 2.25 is mostly about that gap. It is a less glamorous release than a new editor or a new report, and it is the one I have wanted to build for a while.
Your server tells the dashboard it is alive
Turn monitoring on and your install reports its health once a minute to your dashboard on sendbroadcast.net. When everything is fine, that page is boring, which is the point.
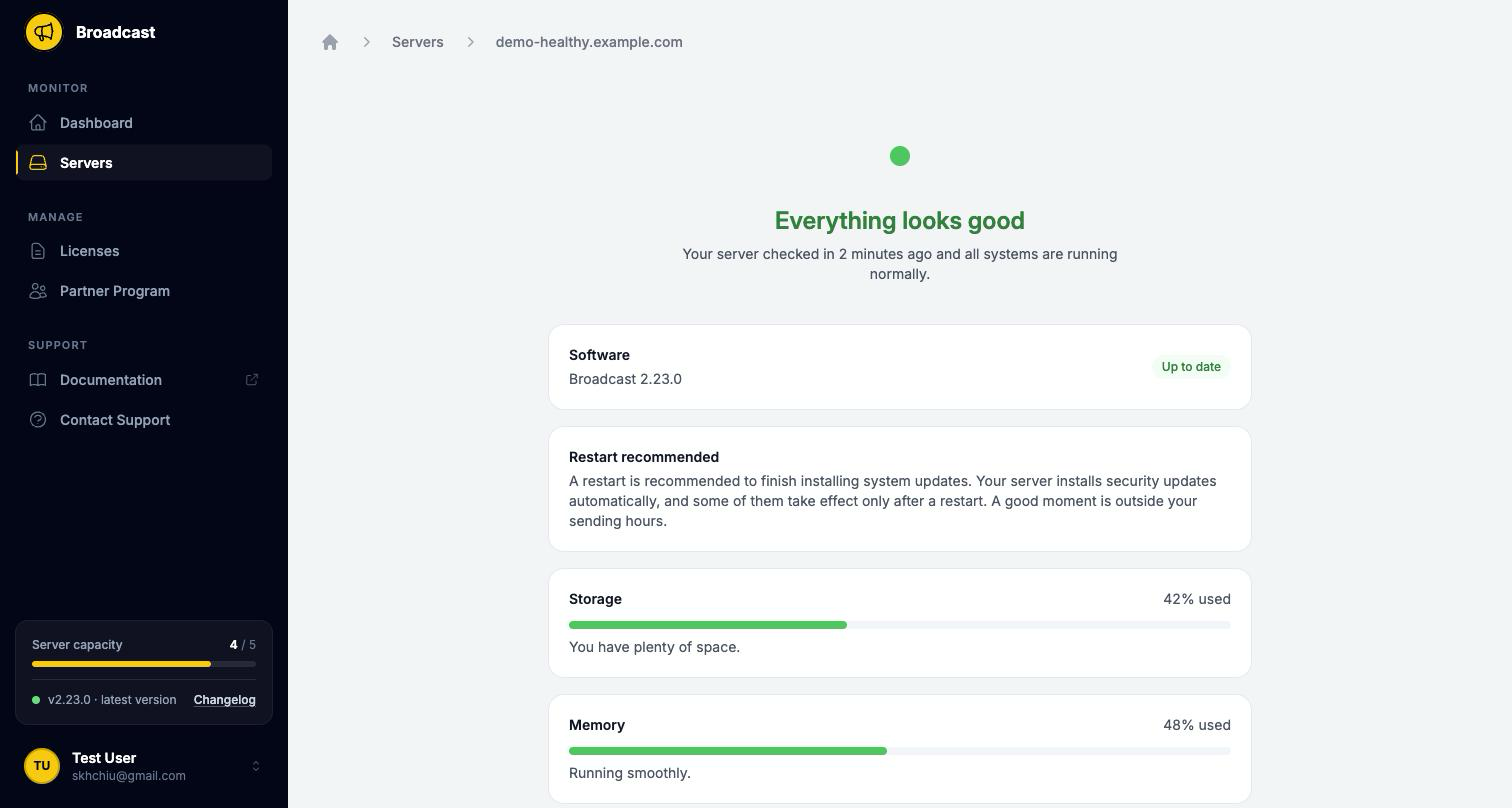
Storage and memory are there because they are the two things that kill a small box quietly. Disk in particular fills up in a way nobody notices until the database refuses to write.
When the check-ins stop, you get an email. Detection to alert takes about two minutes in practice, which I measured on a real server rather than estimated. You get a second email when it comes back, because “is it fixed yet” is the other question you have at 3am.
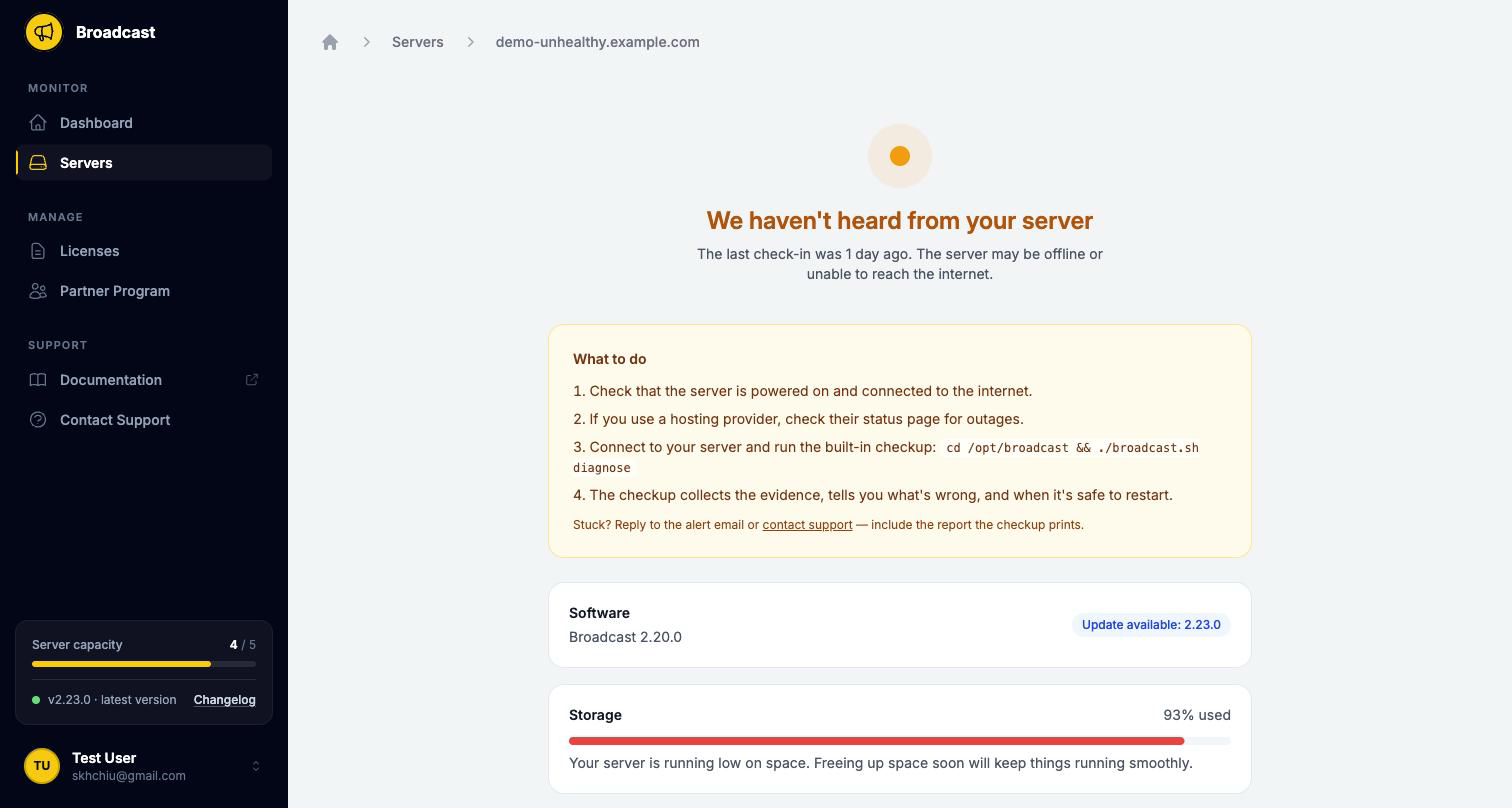
The page does not just tell you something is wrong. It tells you what to try, in order, ending with the command that collects the evidence. An alert that only says “down” leaves you exactly where you were.
Monitoring you can prove is off
Monitoring is opt-in, and I want the opt-out to be verifiable rather than a promise in a privacy page.
monitor-enable and monitor-disable switch reporting on and off. With it off, nothing is sent, and you can confirm that yourself by watching the outbound traffic rather than taking my word for it. If you run this software precisely because you do not want a vendor watching your infrastructure, that position is respected by default and reversible in one command.
One command that collects the evidence
When something is wrong, the worst part is not the fault. It is assembling the story: which logs, from which container, from before or after the restart, plus the six things you already tried.
diagnose does that in one step. It captures the logs first, before any other action can rotate or destroy them, then runs health probes in layers, from “is the machine up” through “is the database answering” to “is the app serving requests”. It builds a timeline of the incident and prints a report you can paste into an email to me.
The ordering matters more than it sounds. Our own incident lost its evidence because the restart came first. Now the logs go to journald and survive restarts, and diagnose reads the journal before anything else.
Repairing the boring kind of broken
Most broken installs are not dramatic. A directory has the wrong owner after a manual copy, a systemd unit was edited and never reloaded, a cron entry vanished, an env key is missing after a half-finished upgrade.
fix repairs that drift, and it is idempotent, so running it twice is safe and running it on a healthy install does nothing. It also tells you plainly what it cannot fix rather than exiting zero and leaving you to discover the rest yourself.
Restores got the same treatment. A restore now verifies the backup checksum before it trusts it, refuses to run against an incompatible version, and takes --yes for automation. It also no longer prints “RESTORE COMPLETE” when the restore failed, which is the single most dangerous message a backup tool can produce.
Three ways this actually plays out
Your disk fills up overnight. You get a down email at 03:12, open the dashboard on your phone, see storage at 98%, and know before you open a terminal whether this is a disk problem or a network problem.
An upgrade half-applies and the app will not come up. You run diagnose, get a timeline showing the container restarted twice and the database never accepted a connection, and paste the report into a support email that does not need six rounds of “can you send me the logs”.
You take over a server someone else installed. You run fix, which corrects the ownership and the missing cron entry it finds, and reports the one thing it will not touch. Ten minutes instead of an afternoon of comparing against the docs.
Also in 2.25
Recipient counts now agree with each other everywhere they appear, which came out of a customer report and turned out to be six different pieces of code answering the same question differently. Someone in two selected segments is now counted once rather than twice, and unsubscribed subscribers are no longer included in the estimate.
Duplicating a broadcast now keeps its audience, its email server selection, its tags and its custom headers. Previously a copy of a campaign aimed at one segment came back aimed at everybody, which is a bad surprise to have after clicking send.
Timestamps throughout the app now display in your timezone instead of UTC, including the day boundaries used to group charts, so activity late in your evening is counted on the day it happened for you rather than the next one.
See the monitoring and logs documentation for how health reporting works and how to turn it off, or read why your install should tell you when it is out of date.