Monitoring and Logs
When something looks wrong — a broadcast that never finished, an email server that stopped accepting mail, a webhook that isn’t firing — Broadcast has four places to look. They all live under Application → Monitoring in the sidebar:
| Page | Answers |
|---|---|
| Application Logs | What is the app doing right now? |
| Error Logs | What went wrong, and has anyone dealt with it? |
| Host System | What does the server itself look like? |
| Jobs | Is background work running, queued, or failing? |
All four require the system settings permission. Users without it don’t see the Application section at all.
Note
Start with Error Logs. It is a curated list of things Broadcast already decided were problems, so it is almost always faster than reading raw output. Drop to Application Logs when you need the detail behind an entry.
Error Logs
Error Logs is the record of failures Broadcast noticed on its own — a rejected SMTP login, a webhook endpoint that kept returning 502, an import that skipped rows, a DNS record that drifted from its baseline.
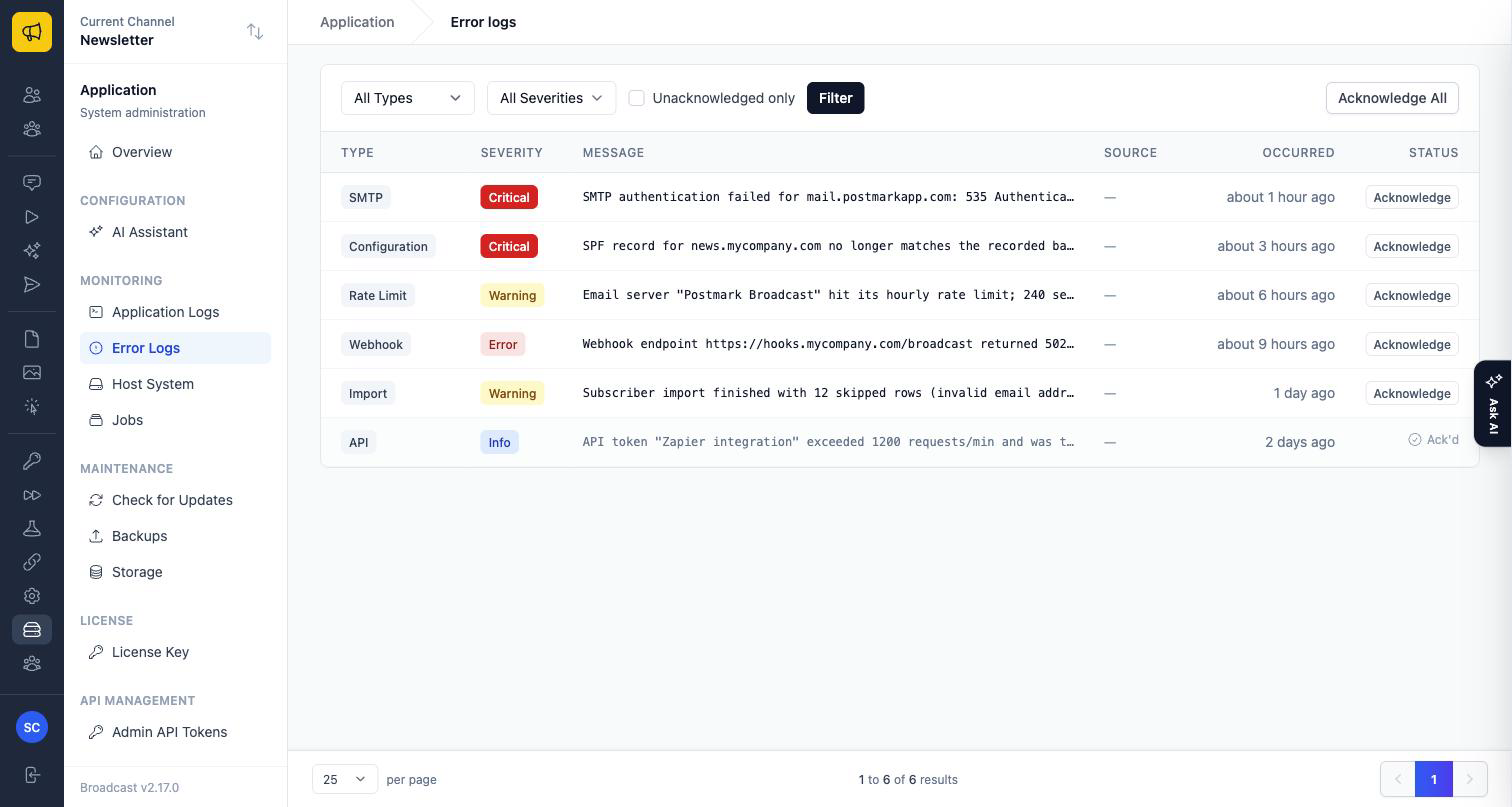
Each entry carries a type and a severity.
| Type | Typically raised by |
|---|---|
Configuration |
Setup problems, including SPF/DKIM/DMARC drift |
SMTP |
Authentication or connection failures against an email server |
API |
Rejected or throttled API requests |
Rate Limit |
An email server hitting its configured send limit |
Validation |
Records rejected for invalid data |
Import |
Subscriber import problems |
Webhook |
Endpoints that failed to accept a delivery |
Unknown |
Anything that didn’t fit the categories above |
Severities run Info, Warning, Error, Critical. Critical entries are the ones worth interrupting your day for — a failed SMTP login means mail is not going out.
Filtering and acknowledging
The filter bar narrows by type, by severity, and to unacknowledged entries only. Acknowledge marks a single entry as handled; Acknowledge All marks everything matching the current filter, so filter first if you only mean to clear one category.
Acknowledging is bookkeeping, not repair — it records that a human looked at the entry. Nothing is deleted.
Clicking a row opens the full entry, including the untruncated message and the channel it belongs to:
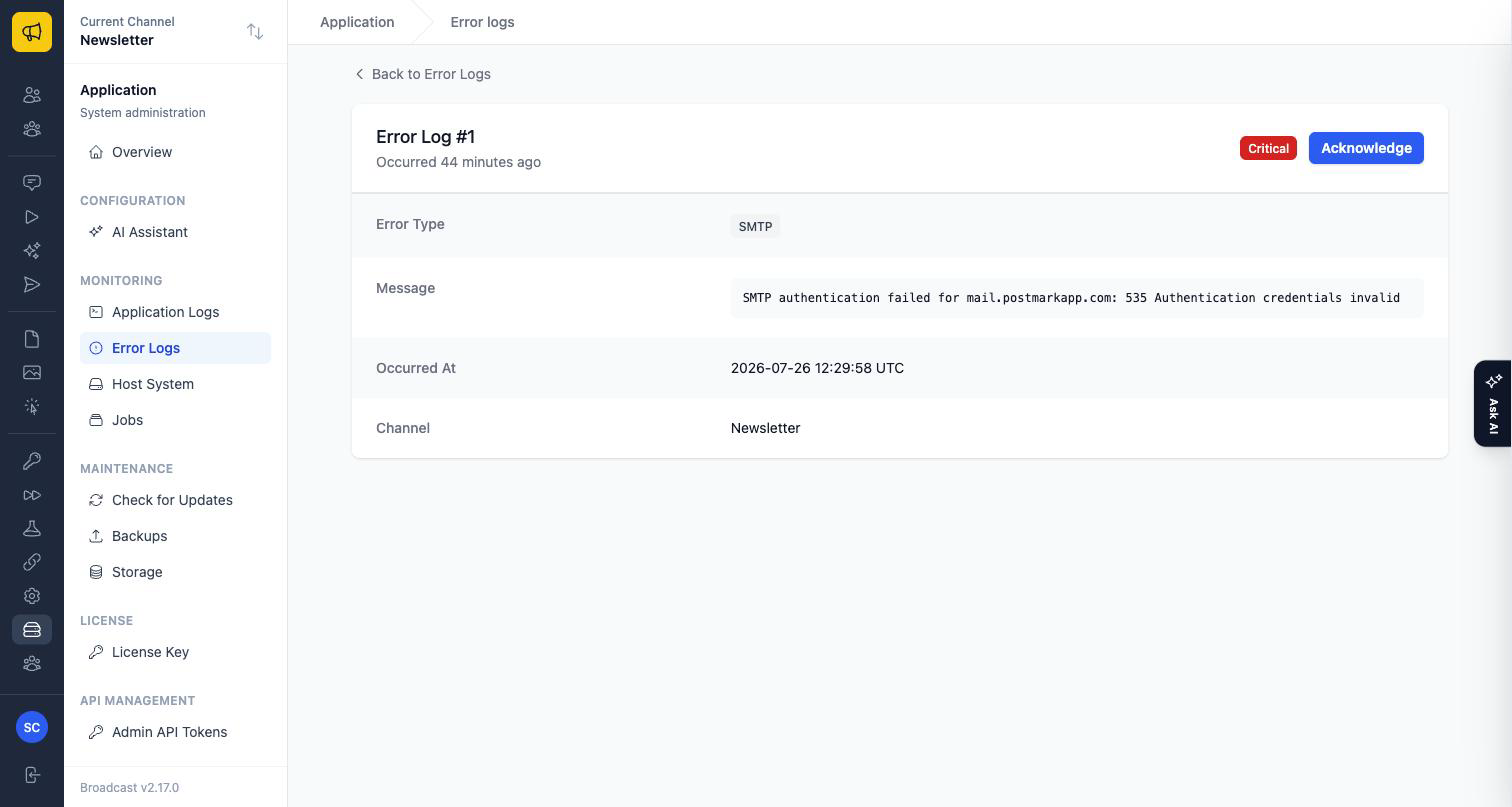
Some features write here deliberately. Domain authentication drift, for example, raises an entry after two consecutive failed checks — see Domain DNS Health.
Application Logs
Application Logs streams your installation’s log output into the browser, live. Use it when an Error Log entry doesn’t explain enough, or when you want to watch something happen as you trigger it.
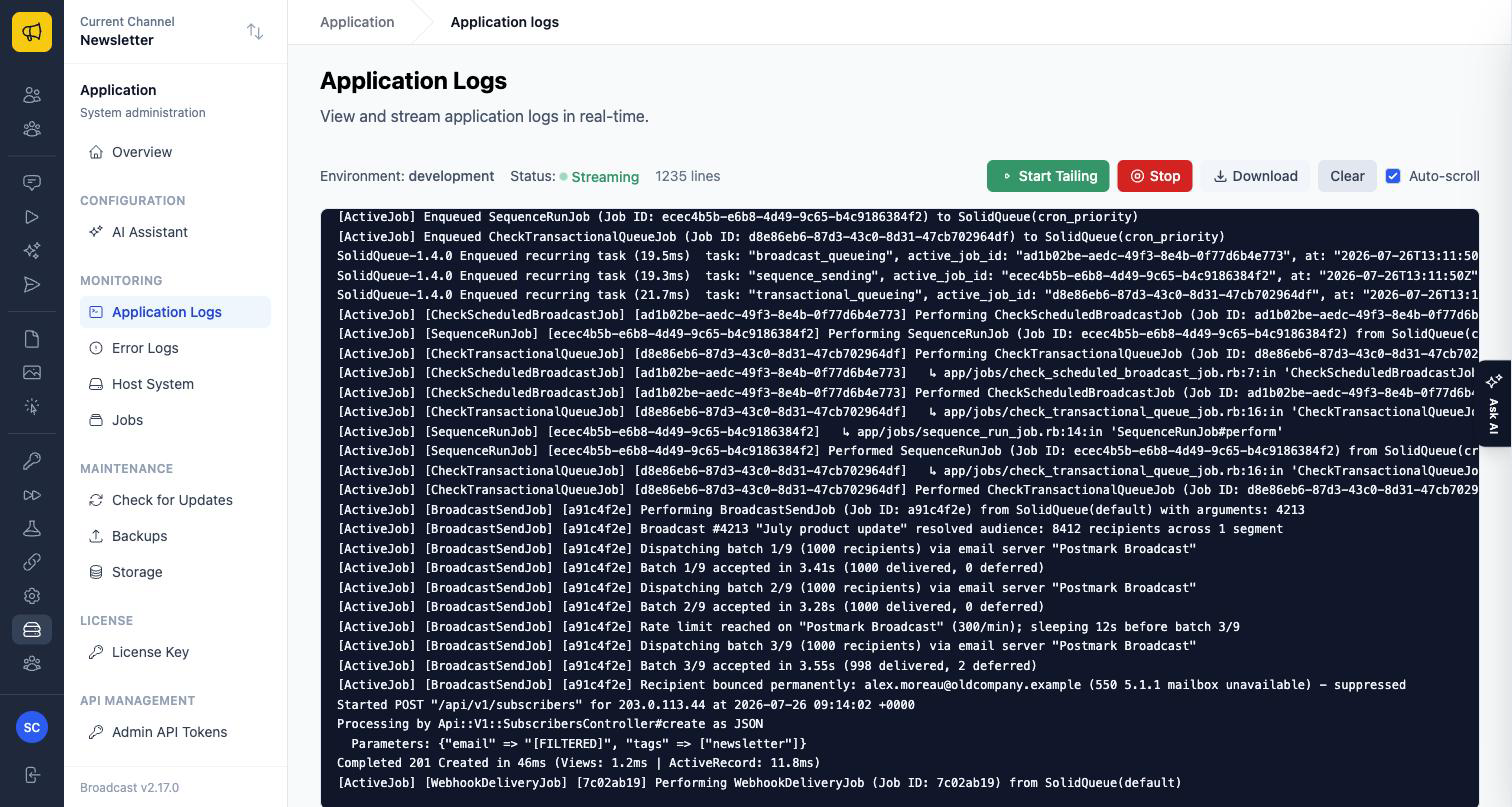
The controls:
- Start Tailing / Stop — begin or end streaming.
- Download — save what’s on screen as a text file (see below).
- Clear — empty the on-screen buffer. It does not touch the log file.
- Auto-scroll — keep the newest line in view; uncheck it to read back without being yanked to the bottom.
Three behaviours are worth knowing:
- You get history immediately. On connect, Broadcast sends roughly the last 200 lines before it starts following the file, so a quiet installation shows its recent past instead of an empty box.
- Streaming stops itself after 2000 lines. This keeps a busy server from flooding your browser. Click Start Tailing to continue.
- A stale log file says so. If the file hasn’t been written to in over a minute, the viewer posts a notice that the host log streamer may be starting up or stopped. Without it, a stalled streamer and an idle app look identical.
To search what you’ve captured, use your browser’s own find (Cmd+F / Ctrl+F).
Sending logs to support
Download packages the captured lines into a broadcast-logs-<timestamp>.txt
file. Broadcast writes a short header into it first — your version, the
environment, whether the installation is managed, the capture time, and the line
count — which is exactly the context support would otherwise have to ask you for.
The workflow when reporting a problem:
- Click Start Tailing.
- Reproduce the problem.
- Click Download.
- Email the file to
support@sendbroadcast.netwith a description of what you saw. The page’s footer link opens a pre-addressed message.
Warning
Read the capture before you send it. Application logs can contain subscriber email addresses and other personal data.
Jobs
Almost everything slow in Broadcast — sending a broadcast, running a sequence step, delivering a webhook, checking DNS — happens in a background job. The Jobs dashboard is where you confirm that work is actually moving.
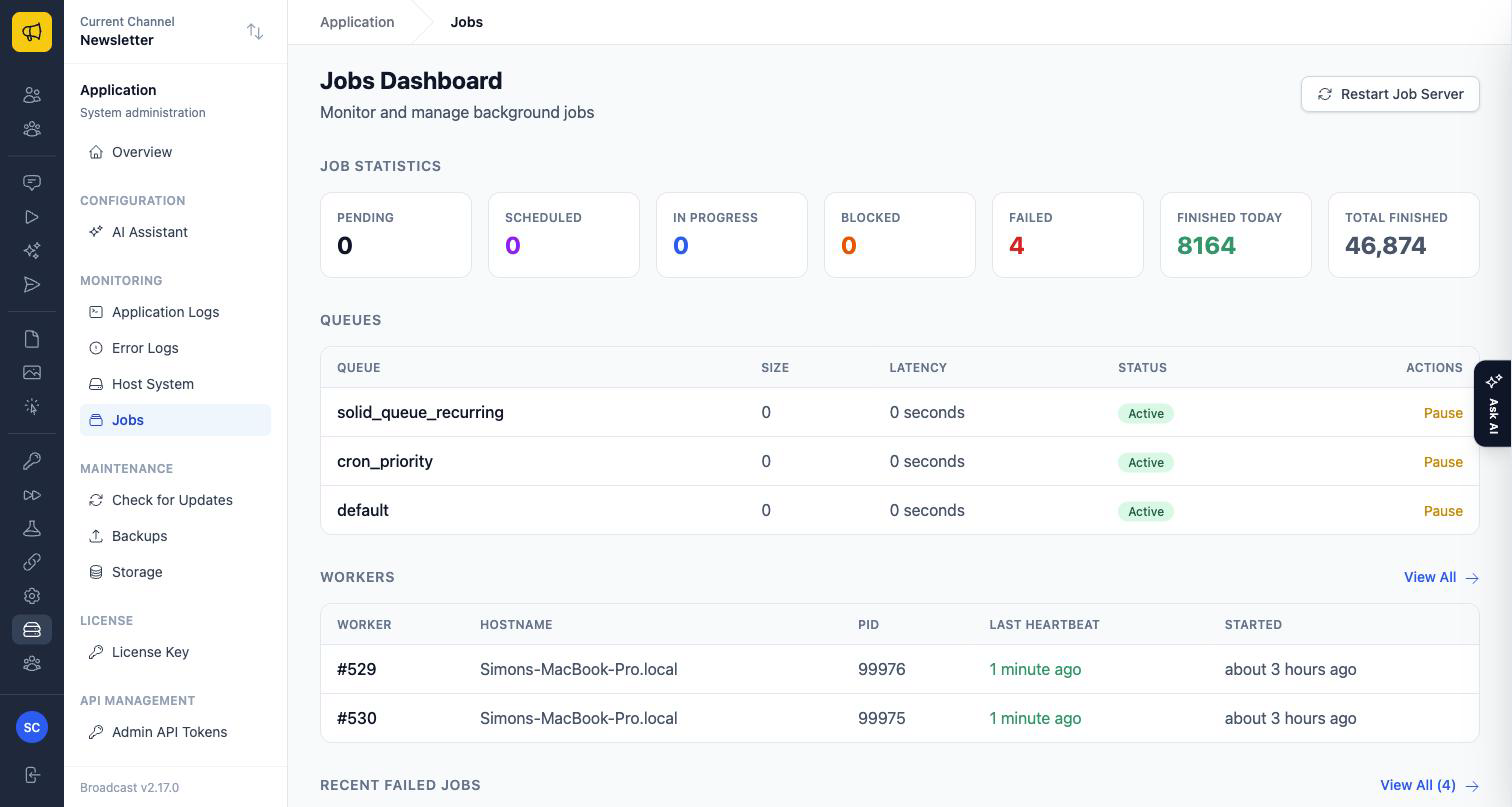
Job statistics count jobs by state: Pending, Scheduled, In Progress, Blocked, Failed, Finished today, and Total finished.
Queues lists each queue with its size, latency, and status. Latency is the useful number: a queue with a size of zero is idle, but a queue with steady size and growing latency is falling behind. Each queue can be paused, resumed, or cleared, and there are pause-all and resume-all controls.
Workers lists the processes doing the work, with a last-heartbeat time. If there are no workers, or every heartbeat is stale, nothing is being processed no matter how healthy the queues look. Dead workers can be pruned.
Recent failed jobs shows what gave up. Individual jobs can be retried or discarded, and the failed-jobs view supports retrying or discarding in bulk. Retry is safe for email sends: delivery is idempotent, so a retried broadcast job will not re-send to recipients it already delivered to.
Restart Job Server restarts the background worker process. Reach for it when workers are gone or wedged, not as a routine fix.
A troubleshooting order that works
- Error Logs — has Broadcast already identified the problem? Filter to Critical first.
- Jobs — are workers alive and queues draining? A stuck broadcast is far more often a stalled worker than a bug.
- Application Logs — tail while reproducing the problem, to see the detail behind either of the above.
- Download and send to support if the cause still isn’t clear.
Related: Domain DNS Health for authentication-record monitoring, Email Server Rate Limits for deferred sends, and Backup & Recovery for backup and restore.